The Rite Method With Affinity Mapping: An Effective Duo

The Rapid Iterative Testing and Evaluation (RITE) method was pioneered at Microsoft Games Studios and Microsoft Research and has been used in a variety of industries since. Traditional usability testing runs all the participants, analyzes the data, and then makes recommendations. The RITE method differs from traditional usability testing in many ways. One key difference is data analysis and recommended changes happen after every participant. As soon as a problem is identified and a possible solution reveals itself, the change is made. This is a method used to get rapid results that can be implemented into immediate changes.
Considering that the RITE method requires rapid changes, it is helpful to get others involved in the data analysis and affinity diagramming is a great tool for this. Affinity diagramming, also known as affinity mapping or collaborative sorting, is a method that can be used for qualitative data analysis and allows for collaborative & iterative data analysis (see image 1). In this use of affinity diagramming, new data is added to it after every participant. Affinity diagramming can be used in design-ideation meetings; however I will focus on its use for research observation data. In order to get a sense of how RITE method and affinity mapping work together, I will be using examples from a study I completed in May 2019 with the Applied Research in Gaming Lab (ARGL) at Wichita State.
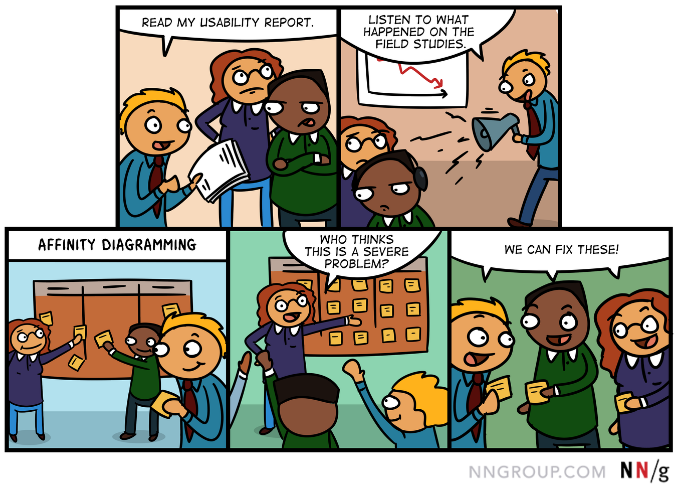
Image 1: Affinity Diagramming
Project Overview
A team of four UX researchers created a board game and used the RITE method to do usability testing with four board game players. Each participant played a few rounds of the game with three of the researchers while the remaining researcher took detailed notes. The participant was asked to take the lead and teach the other players like they were playing with their little cousins. After each participant, affinity diagramming was performed to analyze the data. Problems were ranked and changes were immediately implemented. The general process of the study is shown in image 2.
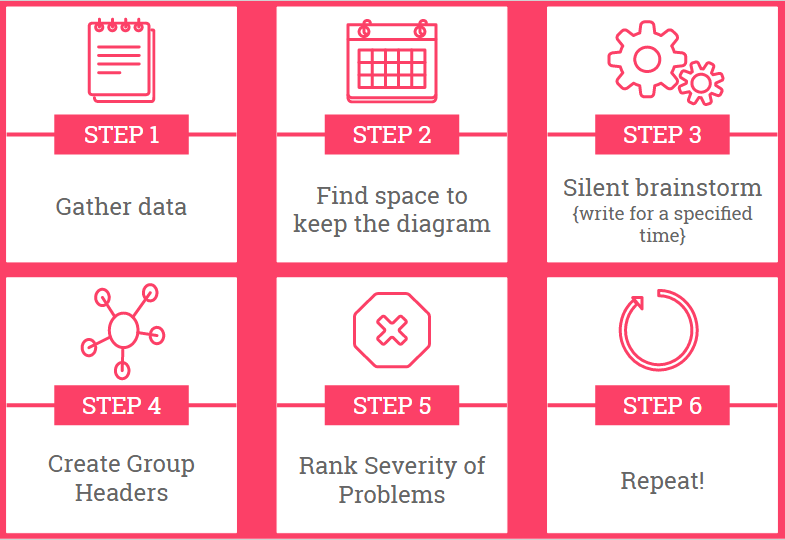
Image 2: Process of Study (Image Credit to Alexis Raushel)
Initial analysis
After each participant session, an hour was blocked off for analyzing the session in an adjacent room. Affinity diagramming works best if observers first have the opportunity to gather their thoughts privately before beginning diagramming, so researchers were first given some time to work through their notes. Sticky notes are commonly used to represent data, with each color representing a participant. This helps keep the data organized and helps researchers see the data in terms of quantity. For example, it was easy to see that participants had a lot of feedback for “Abilities” because there were several sticky notes about this in every color by the end of the study. A best practice for this sort of analysis is having each researcher silently and individually identify problems and focus on quantity not quality of problems. Even if a problem seems minor, including it will aid the analysis process, especially if another participant experiences the same issue. All the sticky notes were placed in the center of the board and the researchers grouped the data.
Image 3: Affinity Diagramming Example
Describing the data
During the organization of the data, sticky notes were moved into groups based on similarity (image 3). Each note was discussed until there was a consensus on proper placement. During this time there was discussion and clarification about what certain notes meant until all the notes were grouped. In some cases, a group consisted of a single sticky note (such as in image 5). Headers can be useful for organization. For this project, sub-headers were used to distinguish the data and super headers were used to group sub-headers together (image 4, yellow box). The green boxes in image 4 show some headers that fall under the super header of “Items.”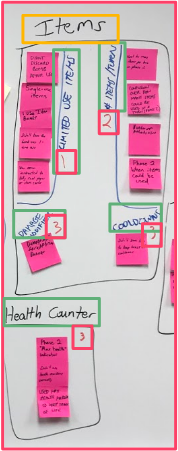
Image 4: Headers
The next step was to rank the severity of each of the groups. The purpose of ranking is to help priortize problems. Researchers may get hung up on one problem and spend an excessive amount of time talking about a certain point. One goal of RITE method is to make changes between each participant, so it is important to make quick decisions.

Image 5: Affinity diagramming progression between 4 participants
Severity ratings
To expedite the decision making process for this project, a decision maker was designated. This person was not necessarily the person who was “in charge,” but they were the person to make the final decision in what changes were made while considering the other researcher’s thoughts. To help with the decision of what to change, the researchers rated each of the problems as a number explained on image 6.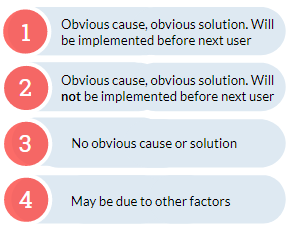 Each group was given a severity rating (displayed in red boxes on image 4). The severity rating of 1 corresponds to what is able to be changed before the next session. Each problem was documented in a sheet and organized as a column of problems and a row of participant numbers above. Each problem was marked for severity and if each participant experienced this problem. Clearly the first participant had experienced all of the problems, but the remaining participants may or may not experience the same problems. Marking if each participant experienced a problem helped the decision maker choose which problems to address each cycle. Additionally, if no other participants experienced this problem, then the change theoretically worked. A participant key (image 5 four participants image in the top right corner) was helpful to remember what color sticky note corresponded with each participant.
Image 6: Severity rating description
The RITE method combined with affinity diagramming is an effective duo but requires a lot of time and commitment from the team. Traditional thematic analysis puts a lot of the data analysis workload on one person, whereas this method allows for all team members to be involved and see what impact each of the changes had. This collaborative nature is a great way to allow the team to see what users think about the product.
Key Points
- The RITE method can be a quick and effective way to get user feedback, but it requires a team to set aside huge sections of time.
- The RITE method is best for making small changes between participants. Big code changes or overarching changes will be difficult. It’s up to the team to decide what changes can be made in that time and who is available to make those changes.
- Qualitative data can be time-consuming to analyze, but using affinity diagramming within the RITE method can make this process collabortive.
- Affinity Diagramming offers a way to think about the data in an iterative way. The researchers can build upon the data and see it visually evolve in front of them.
Jasmine Granados has a MA in Human Factors Psychology and is currently working on her PhD in Human Factors Psychology at Wichita State University. Her research interest is in Games UX and how to improve a player’s experience from either hardware or software changes. She works with an expert team of UX professionals at Human Interfaces to develop custom research solutions for any UX challenge. If you need help from a full-service UX research consultancy for a study, recruitment, or facility rental, visit our website, send us an email, or connect with us through LinkedIn.

